S5.2: Accessibility

Course Organisation

  • Only five of you have completed the Ethics Check. This is worrying. Everyone who works with human participants MUST complete the questionnaire, linked on LEARN.
  • I will offer TopHat office hours while I am away where I will answer questions about the quiz and the usability assessment. I will try to check the TopHat threads daily.


Starter

A database of video and audio content was shut down because it was not accessible. Is that justified?

https://www.insidehighered.com/news/2017/03/06/u-california-berkeley-delete-publicly-available-educational-content

Themes from the Questions and Comments

Misconception 1: Accessibility means simplifying things

That’s not true. Inclusive design makes it very clear that accessible designs make life easer for everyone. Think of barrier free public transport.

Misconception 2: Accessible designs are ugly

This is because specialist designs address a small, captive audience.

Compare this wheelchair fashion site to this article, which clearly takes people’s desire for nice clothes into account.

Misconception 3: Accessibility is only for people who are blind, deaf, or otherwise significantly impaired

Every disability exists on a scale, and it’s beneficial to think of those who have trouble seeing, for those who are hard of hearing, and for those who can’t move very well.

S5.1: Social Aspects

Course Organisation

  • For the Quiz, look at the “Remember” sections of the first four weeks, including Session 5.2 (tomorrow), write down the concepts, and make sure that you understand the definitions.
  • You can only go forward through the Quiz
  • We expect to have all Tutorial Presences entered into Top Hat by the end of Reading Week
  • The Tutorial Presences are registered in TopHat in a weird way, because the only way we can mark attendance manually is to create a “manual attendance” column, which shows all 155 students on TopHat automatically as present, and there is no way for us to automatically switch that to a default of “absent” for all 155 students. So we have agreed the following rule with the ITO:
    • Students who were present at a Tutorial are marked as “excused”
    • Students who were absent at all of the Tutorials are left as “present”

Starting Point: Online Games as Social Networks

Examples of networks and network-like elements in Games:

  1. Farmville (RIP)
  2. World of Warcraft

How the World of Warcraft community discusses cyberbullying

A long read on cyberbullying in World of Warcraft

Themes from Last Year’s Questions and Comments

Race and socioeconomic status

One student pointed out in the questions and comments – quite rightly! – that it appears rude and unthoughtful to say that race is correlated with socioeconomic status.

Race does not determine socioeconomic status; in the current century, you will find people of all races and skin colours at all levels of society. However, in some societies, people of some races are much more likely to be disadvantaged and feel disadvantaged.

Here are some resources:

Activity 1: Definition of Race

If you look at the definitions of race in the US versus the UK, what are the main differences? Why do you think some ethnic groups are highlighted?

Tip: For the US, look at the Wage Gaps data; for the UK, look at the Government definition.

What are the relevant Ethnic groups in your home country?

What is socioeconomic status?

Going back to the two UK resources, you will see that they highlight several areas of inequality. The Race Report talks about Employment, Education, Living Standards, Crime, and Health and Care. All of these contribute to socioeconomic status. Each of these areas is made up of separate statistics.

Activity 2: Aspects of Socioeconomic Status

What aspects are discussed in the UK Government statistics? How might each of the six areas (Education, Crime, Housing, Health, Work, Culture) contribute to the likelihood that

  • a person has a cheap smartphone
  • a person has a laptop
  • a person has a high-end smartphone (Galaxy S8, iPhone X)


S4.2: CSCW Questions and Errors

Course Organisation

  • Start studying for the Quiz! A practice quiz will be up soon. To prepare, make a list of all the concepts that are in the “Remember” section of the Learning outcomes, see whether you know their definition, and check by talking to classmates whether you understand them
  • You do not need participant consent for studying posts from a social media web site, but you should still be careful with the data you handle.

Starter

If you can’t find information about the coursework structure, and are confused about the DPT, who is at fault? If we want to solve the problem, how can we go about it? Do we blame people or do we change the system?

Some Themes from Questions and Comments

Here’s a clear explanation of why attribution error matters – is it the user’s fault? Is it the technology’s fault? Or is this just a complex system?

CREAM and THEA are two possible frameworks for analysing sources of error early – CREAM is obsolete now, see why in the linked blog post. For THEA, see this paper with worked examples and why it matters. The THEA paper emphasises just how important it is to have an accurate understanding of the context of use and the user themselves.


S3.2: Descriptive Statistics

Course Organisation

During today’s session, I will mostly work through some example descriptive statistics with you. The resources for revising the concepts are listed in this post.

Starter

We will discuss the Usability Assignment on LEARN.

Resources

I strongly recommend this online textbook: Online Statistics Education, an Interactive Multimedia Course of Study

The relevant sections for you are the Introduction (Sections 1-11), Summarising Distributions, Graphing Distributions, and Research Design. These are the basic skills you should have for reporting your data.


S3.1: Usability Assessment

Course Organisation

  • Please all sign up for tutorials via LEARN. We use tutorials to check attendance, which is particularly important for students on Tier 4 visas.
  • If you miss Questions and Comments, you can’t make up for them. They are a very small part of the final grade, though.
  • The Assignment for the Usability Study will be released tomorrow.
  • Questions about my MSc projects? I have two information sessions on Friday, February 1, 2-3 and 3-4, Room 4.31/4.33 Informatics Forum, or you can ask me after the lecture. You must complete the Google Form for me to rate you suitable.

Starter

Compare the landing pages of four big search engines:

What are the main differences?

Themes from Questions and Comments

Which Technique to Use When?

As with all research, this depends on

  • how much time you have to design and run a study
  • what access you have to end users
  • what equipment you have
  • what you want to find out

Whether a study in the lab is valid depends on how much findings will be affected by context. For example, if you want to use eye tracking to find out what draws attention, and what users read first, you can do that in the lab.

More on A/B testing

A/B testing is useful if you have an alternative (B) to your existing design (A) that you wish to test, if you have a substantial user base already, so that you can get enough data, and if you have put enough work into B to be able to deploy it. It is for solutions that are either easy to implement, or that have been pre-tested sufficiently. Lab studies are useful for pre-testing.

Field experiments are often neglected, because they are difficult to do, but these can tell you the most about how your system is actually used in practice. Methods from ethnography are useful here.

Heuristic Evaluation – What and Why?

You use guidelines and design patterns to create your technology, and you can use heuristic evaluation to check what you have created. Here are some more practical examples of the classic Nielsen guidelines: 10 usability heuristics with examples.

Heuristics also need to be weighed against each other – there is a good reason why Naver is less minimalist than Google!

Face Validity

Many questionnaires don’t measure what they are intended to measure or what they appear to measure. Face validity is all about appearance. Does it look like a questionnaire is measuring usability (face validity), or does it actually measure usability (construct validity)? We care about construct  validity. I often recommend the System Usability Scale to my students for measuring user satisfaction – this link to the paper should work. Although the SUS was designed to be quick and dirty, it has turned out to have good reliability and good construct validity, and it has been used over so many studies that values are now well calibrated.

S2.2: Cognition (2019)

Course Organisation

  • Don’t worry if you missed the Questions and Comments from Week 2. You will still be able to do well on the assignment.
  • We have tutorials! You can sign up on LEARN – the link to Tutorial Groups is on the left hand side, below “Announcements”. There are 8 groups at the moment. We start next week.

Starter

When Microsoft switched from Windows 7 to Windows 8, the new user interface was a shock, because it ditched most existing mental models of what the Windows operating system should look like.

This article is a good summary of the main critiques when Windows 8 first came out. (Also: Anyone remember netbooks?)

This article is a good reminder of why usability doesn’t predict sales. (Also remember: what Steve Jobs and Apple did was to make actual user needs, which can be quite different from what users think they need, part of their design process.)

Themes from Questions and Comments

Theme 1: Clarifying the different types of memory

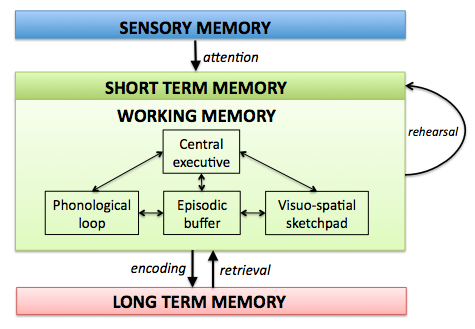
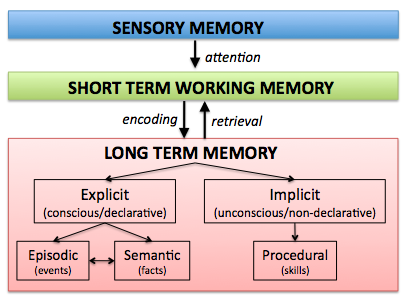
What I am teaching you here is one particular type of theory, based on the approach of Alan Baddeley and colleagues, which is well studied and has a lot of evidence. The graphics below are based on this theory.

Long term memory versus sensory and short term memory
Relationship between short term, sensory, and working memory
Working memory in the context of different types of memory
How the detailed structure of working memory fits into the picture

Theme 2: Can we avoid user bias?

No – we have to work with them and around them. One of the main points of understanding how perception works is that this knowledge allows you to exploit perceptual biases to structure user interfaces and guide the user’s attention. Perception and cognition are closely linked, for good reason.

Theme 3: Can mental models be changed and adapted?

Yes, they can – but you need to make sure it’s worth the effort

Theme 4: Recall versus recognition

if we want to build interfaces for people who use systems rarely, if we want to add in a layer of redundancy, if we want to help people who have forgotten the commands, we make sure people can recognise what to do.

If we want to make interfaces fast to operate, we support fast recall.


S2.1: Perception (2019)

Course Organisation

  • We now have around 102 people enrolled in the course. I expect ITO to arrange and release tutorial slots soon.
  • The blogs provide a scaffold of what is discussed in class.
  • Questions and Comments are closed for submissions on Monday 9am on the week when the material is discussed, to give me enough time to prepare the lectures based on your feedback.

The News

High pitched sounds repel teens

But is it really needed? (Read the comments!)

From Questions and Comments

What are realistic perceptual thresholds for design?

Realistic thresholds allow people to perceive signals in realistic contexts. This is why questionnaires ask people to report how well they can do in typical situations where they will use a certain sense. For example, for vision, one would ask how well a person can read newspaper headlines, or for hearing, whether they can hear birds chirping in the trees.

For hearing, think about background noise. The signal needs to be louder than the noise (signal to noise ratio).

Example from radio 

Thresholds, for example for people’s ability to understand speech, are calibrated first using standardised tests in quiet, and then tested again with background noise.

Thresholds vary from person to person – they are affected by age, acute illness, chronic illness …

In order to decide on the correct thresholds for design, we need to understand

  • who is using our systems
  • under what circumstances

What is Signal Detection Theory, and why does it matter?

Here is an alternative introduction by David Hager.

Link to Machine Learning: The Receiver Operating Characteristic is related to Signal Detection Theory

What are affordances, and why should we care?

Physical affordances are what you can do with a physical object – properties of the object that you can act on. For example, pick it up, wave your hands in front of it, move your hands under it, move the handle …

Example: Washroom water taps. This one by Dyson is particularly badly designed, because it is very easy to dry your hands when you just want water.

Perceived affordances are about what users think they  can do  with an interface.

Conventions is what designers use to communicate with users, to signal to them that something could be of interest / can be interacted with

Example: Where are buttons and links that you can click on a web site? How do you notice? When this is not clear, we have a case of Mystery Meat Navigation

Many of the examples on the Bad Designs web site are bad because of the affordances.

Affordances can also be ignored: See the “Desirepath” subreddit, where people subvert designed paths to make their own

Week 9: CSCW

Course Organisation

  • This is the last week of Questions and Comments, and the last week I will be teaching you
  • The Quiz will cover Weeks 2-5, and what you need to study are the things listed under “Remember” in the Learning Outcomes
  • If you have further questions about the Usability Report, I will announce Office Hours on Monday April 16.
  • For the last two weeks, we will be in the Psychology Building, S1 (7 George Square, second floor), and you will have guest lectures on information retrieval and data visualisation

Themes from Questions and Comments

For each theme, I am giving you a paper that shows how the concept can be used to analyse collaboration using technology.

Articulation Work:

Grant, S., Mesman, J., & Guthrie, B. (2016). Spatio-temporal elements of articulation work in the achievement of repeat prescribing safety in UK general practice. Sociology of Health & Illness, 38(2), 306–324. https://doi.org/10.1111/1467-9566.12308

Attribution Theory:

Diamant, E. I., Fussell, S. R., & Lo, F. (2008). Where Did We Turn Wrong?: Unpacking the Effect of Culture and Technology on Attributions of Team Performance. In Proceedings of the 2008 ACM Conference on Computer Supported Cooperative Work (pp. 383–392). New York, NY, USA: ACM. https://doi.org/10.1145/1460563.1460625
Attribution theory focuses on why people think something happened. It is much more satisfying to blame people for errors than to look at aspects of the system that may have contributed to it, but that’s not how highly reliable organisations work:
Reason, J. (2000). Human error: models and management. BMJ, 320(7237), 768–770. https://doi.org/10.1136/bmj.320.7237.768

Activities

These are exercises in qualitative analysis and analysis of text data. Do these alone or in groups.

  1. Looking for keywords: Go to the TopHat activity Museum 1 and determine how many people asked a museum employee. Alternatively, go to the TopHat activity Museum 2 and look for the number of people mentioning the exhibition Down to Earth.
  2. Tabulating mentions of relevant things: Go to the TopHat activity CSCW 2 or 3, and make a list of the solutions that were mentioned, and how often they were mentioned. Is there any information you miss when you just list the solutions?
  3. Going deeper: What do people talk about? Look at one of Museum 4, 5, and 6. What do students mention? The gallery, the exhibit? Do they mention their reaction to the exhibit, social context, usability issues? What else is mentioned?
  4. Analysing Reasons: Look at one of CSCW1, CSCW2, or Information Architecture 2. What types of reasons do people give for their choice? Can you categorise them? If you have chosen IA2, do people give reasons without having been prompted by the question?


Week 5: Social Context

Course Organisation

  • 128 have successfully submitted, 1 has an extension. Looking forward to reading and marking your case studies! We hope to have your feedback ready by March 1 at the very latest.
  • Start thinking about your usability report
  • If you are asking about slides from class: Remember that we are not really using slides. All materials are online, on this web site. An archive of some of the class discussion is on TopHat, where you can see each other’s contributions. Unfortunately, I still haven’t managed to get Media Hopper Replay up and running on my private laptop; there are no facilities in the labs.

Week Structure for the Remaining Weeks

For each of Weeks 6 and 7, you can choose  three out of 12 tasks to complete. These tasks will go live on Top Hat on Wednesday morning, 9am. I will be around between 11am and 3pm (details on the page for the week) on Wednesday to field questions and talk to you about what you find. Post your notes on each task to Top Hat.

The Questions and Comments will remain open until Wednesday midnight, there will be no quiz.

Week 6: Accessing Heritage.

You will be going through the Royal Museum of Scotland and the National Museum of Scotland, and look at how people access and experience the exhibits on display. A list of exhibits will be posted to Top Hat as tasks. The  Page for the week, to be published on Friday, will have more details.

Week 7: Accessibility of the City.

You choose one type of barrier (hearing, mobility, dexterity, no English language skills) and explore how this impairment might affect the experience of visitor attractions and shops. A list of attractions and shops will be posted to Top Hat as tasks. Again, the page will have more details.

Week 8: To Be Determined

Either Industrial Action or topic decided by vote; watch out for an announcement on March 13.

Week 9: Computer-Supported Cooperative Work

As usual – questions and comments plus quiz. From this week onwards, I hope that we have a proper lecture theatre again.

Week 10: Guest Lecture by Dorota Glowacka on Information Retrieval
Week 11: Guest Lecture by Benjamin Bach on Data Visualisation

Starting Point: Online Games as Social Networks

Examples of networks and network-like elements in Games:

  1. Farmville
  2. World of Warcraft

How the World of Warcraft community discusses cyberbullying

A long read on cyberbullying in World of Warcraft

Themes from Questions and Comments and Activities

Race and socioeconomic status

One student pointed out in the questions and comments – quite rightly! – that it appears rude and unthoughtful to say that race is correlated with socioeconomic status.

Race does not determine socioeconomic status; in the current century, you will find people of all races and skin colours at all levels of society. However, in some societies, people of some races are much more likely to be disadvantaged and feel disadvantaged.

Here are some resources:

Activity 1: Definition of Race

If you look at the definitions of race in the US versus the UK, what are the main differences? Why do you think some ethnic groups are highlighted? Tip: For the US, look at the Wage Gaps data; for the UK, look at the Government definition.

What is socioeconomic status?

Going back to the two UK resources, you will see that they highlight several areas of inequality. The Race Report talks about Employment, Education, Living Standards, Crime, and Health and Care. All of these contribute to socioeconomic status. Each of these areas is made up of separate statistics.

Activity 2: Aspects of Socioeconomic Status

What aspects are discussed in the UK Government statistics? How might each of the six areas (Education, Crime, Housing, Health, Work, Culture) contribute to the likelihood that

  • a person has a cheap smartphone
  • a person has a laptop
  • a person has a high-end smartphone (Galaxy S8, iPhone X)

Accommodating Users: Where do We Stop?

It all depends on what you are designing, and what your context of use is. The most useful framework I’ve found so far is the Inclusive Design Cube (Fig. 1, Keates, Clarkson, and Robinson, 2002). Most of your design should be accessible to most people, across the digital divide, and across ability levels.

However, you may choose, depending on your market, to restrict your app, website, or solution to the higher end of the digital divide.

Activity 3: Who is your audience?

Think about the following apps and web sites. Which ones are most likely to be used by people across the digital divide? Which ones are likely to be used by people with mobility, dexterity,  hearing, or vision impairment?

  • Facebook
  • Instagram
  • Uber
  • Priority Pass (airline lounges)
  • Helicopter Hire Web Site
  • justeat
  • UberEats
  • Deliveroo
  • Supermarket online shopping
  • Booking.com
  • Hostelworld
  • amazon.co.uk
  • Ferrari
  • Airline support services for passengers who need special assistance


Week 4: Usability Assessment Techniques

Course Organisation

In Weeks 6 and 7, our classroom will be the city – we are going out into Edinburgh for our class activities. Watch this space!

If you can’t see Questions and Comments or the Quiz any more after you’ve completed it, that’s because they are no longer visible to you after the due date has passed. These assignments are pass / fail, and you pass them if you complete them before the deadline. This is why I don’t allow late submissions, and once the deadline has passed, you can no longer see them in your student view.

Structure of the Session

We will be working mostly with TopHat on practical applications of user assessment techniques.

Task 1: Evaluating Hotel Booking Systems

Choose the hotel booking service with which you are most familiar. How many clicks does it take you to see a list of hotels near London King’s Cross station with free WiFi and a fitness centre? How many different web pages / app pages do you have to visit? How long (in seconds) does it take you to see this? You can do this either by yourself or in groups of 3-4, where one person does the search, one person counts clicks, one person uses a timer, and one person keeps track of pages.

For people with a HCI background: Document the choices available at each step. How can people zoom in on the desired area? What do they need to know about London to do so? If a property has a fitness centre, what do users need to do to figure out whether it has any dumbbells, or whether it just consists of cardio machines? Which kind of person would care about the quality of the hotel gym?

All of you should do the search. If you are searching in a group, then vary your destination – London King’s Cross, Leicester Square, Royal Albert Hall, Greenwich. If you are not working in a group, or if there are less than four of you, make sure that you check out every destination on different booking engines.

Is there anything you can’t find easily? Is there any information that does not appear in the list version?

If you can’t think of a booking engine, try booking.com, lastminute.com, kayak.co.uk.

Rate your booking engine on a scale from 1 to 5, where 1 is very bad and 5 is excellent.

Demonstration: Gray Dawes booking system (Traveldoo)

Task 2: System Usability Scale

Complete a System Usability Scale for the  booking engine you tested yourself.

Demonstration: Analysis of Usability Data

Task 3: Comparing Your Findings to What Others Say

For people without an HCI background: Find the app of one of the booking engines that you examined on the App Store. What are the reviews like? Do they agree with what you’ve found?

For people with an HCI background: Draw up three personas, student on a budget, business traveller, backpacker on a gap year. What are their needs? Who could you ask to find out? Where on the Internet could you find some information without having to interview people? Work alone or in groups of 2-3.